An EMA Crossover strategy, short for Exponential Moving Average Crossover, is one of the most robust trading systems. This simple, yet powerful strategy can be used in any market and any timeframe.
What is an EMA Crossover?
It’s simply two moving averages of different lengths. The idea is to measure acceleration in the market. If the market is accelerating upward, we bet upward. If down, we bet down. This isn’t precise! We’re measuring “drift”.
The “exponential” part means the nearest bars are weighted highest, with the farthest bars being weighted little. I won’t go into the math as it’s both nerdy and unnecessary, but if you’re into that sort of thing you can read about EMA calculations here. Long story short, the different types of moving averages don’t really matter and one isn’t better than another. EMA’s became popular in pre-computer trading because they were easier to calculate by hand than simple or weighted moving averages. We do we use them now? Habit, really.
How do you trade an EMA crossover strategy?
EMA crossover strategies are popular because they are easy to trade.
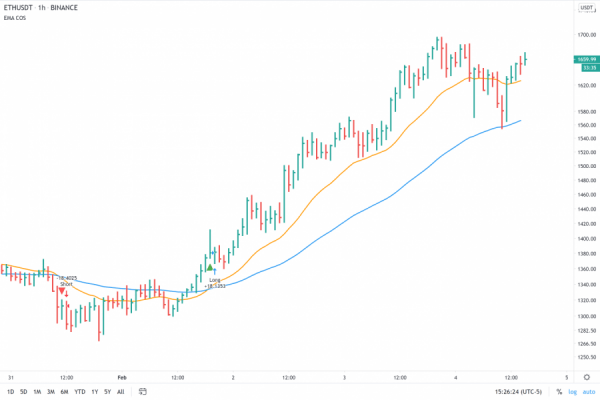
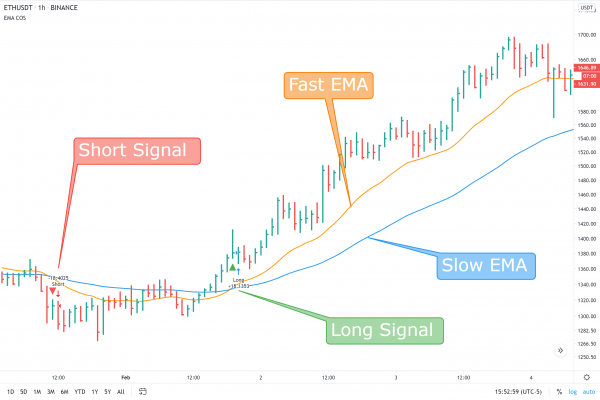
- A Long Signal is given when the Fast EMA crosses over the Slow EMA.
- A Short Signal is given when the Fast EMA crosses under the Slow EMA.
Stay in the trade until the signal reverses. That’s it!
What markets and timeframes does an EMA crossover strategy work best?
While it’s possible to use on any timeframe and market, the better markets are ones with more movement. This is true for basically all trading systems. The trick is to find the correct lengths to use on that market and timeframe. We find those lengths with back-testing.
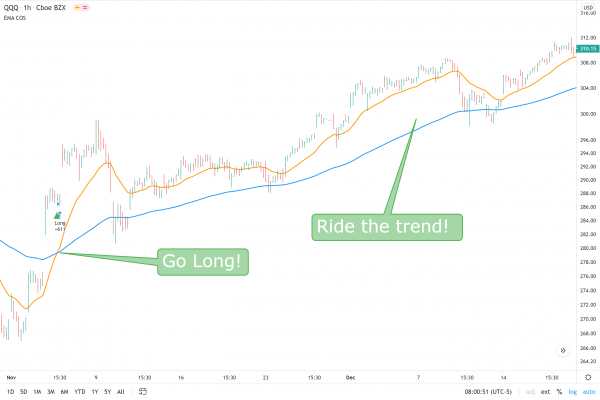
Above is an example on QQQ (NASDAQ). We see the fast EMA (orange) crossing over the slow EMA (blue). This is a signal to go long. We stay in the trade as long as the Fast EMA is over the Slow EMA.
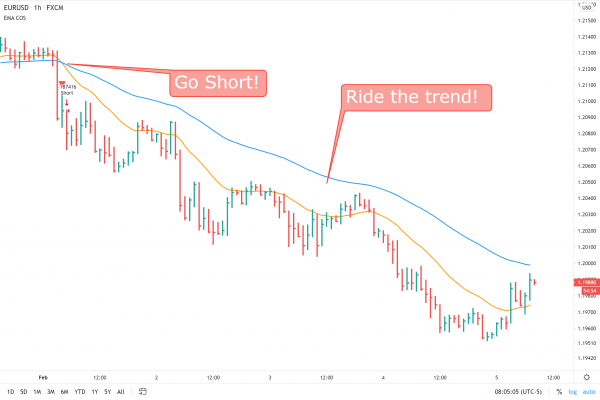
Here is an example on the Euro from the short side. The Fast EMA (orange) crosses under the Slow EMA (blue) and we enter short. We’ll exit when we get a signal in the other direction.
How do you know what markets and timeframes to trade using an EMA crossover strategy?
Most people try to predict the markets, but that’s impossible. Instead, we let the markets tell us what they are. Busy markets tend to stay busy, and quiet markets tend to stay quiet. For example, crypto is notoriously volatile while bonds and real estate are sleepy.
Our main tool for determining which markets to trade: back-testing. We want to see what markets, timeframes, and strategies would’ve worked best before attempting to trade a market. Which would you rather trade: a strategy that was unprofitable in the past, or a strategy that was profitable? Of course we want to trade a profitable strategy! Back-testing is essential.
How do you back-test an EMA crossover strategy?
I created a video on how to back-test and create an EMA crossover strategy for TradingView that will guide you.
I also created an EMA Crossover strategy script so you don’t even have to learn how to program! Just follow the instructions on the video and/or script to find a profitable strategy.
Are there any tips to trading an EMA crossover strategy?
Market Wizard Ed Seykota has two crucial tips:
- The slow line should be at least 3x the length of the fast line.
- This reduces “whipsaws”, back-and-forth losing trades that don’t go anywhere. Cutting down on losing trades also cuts down on the fees, so this is doubly important!
- Some markets, like stocks, should be long-only due to overwhelming upward trends.
- While it sounds fun to try and catch every move of the market, many strategies are just better by betting in a single direction. The stock market has gone nowhere but up for the past 100 years, and Bitcoin gained a literal 5 billion percent in 10 years. Why bet on things like that going down?
My EMA crossover strategy script already does both of these for you!
What results can I expect with an EMA crossover strategy?
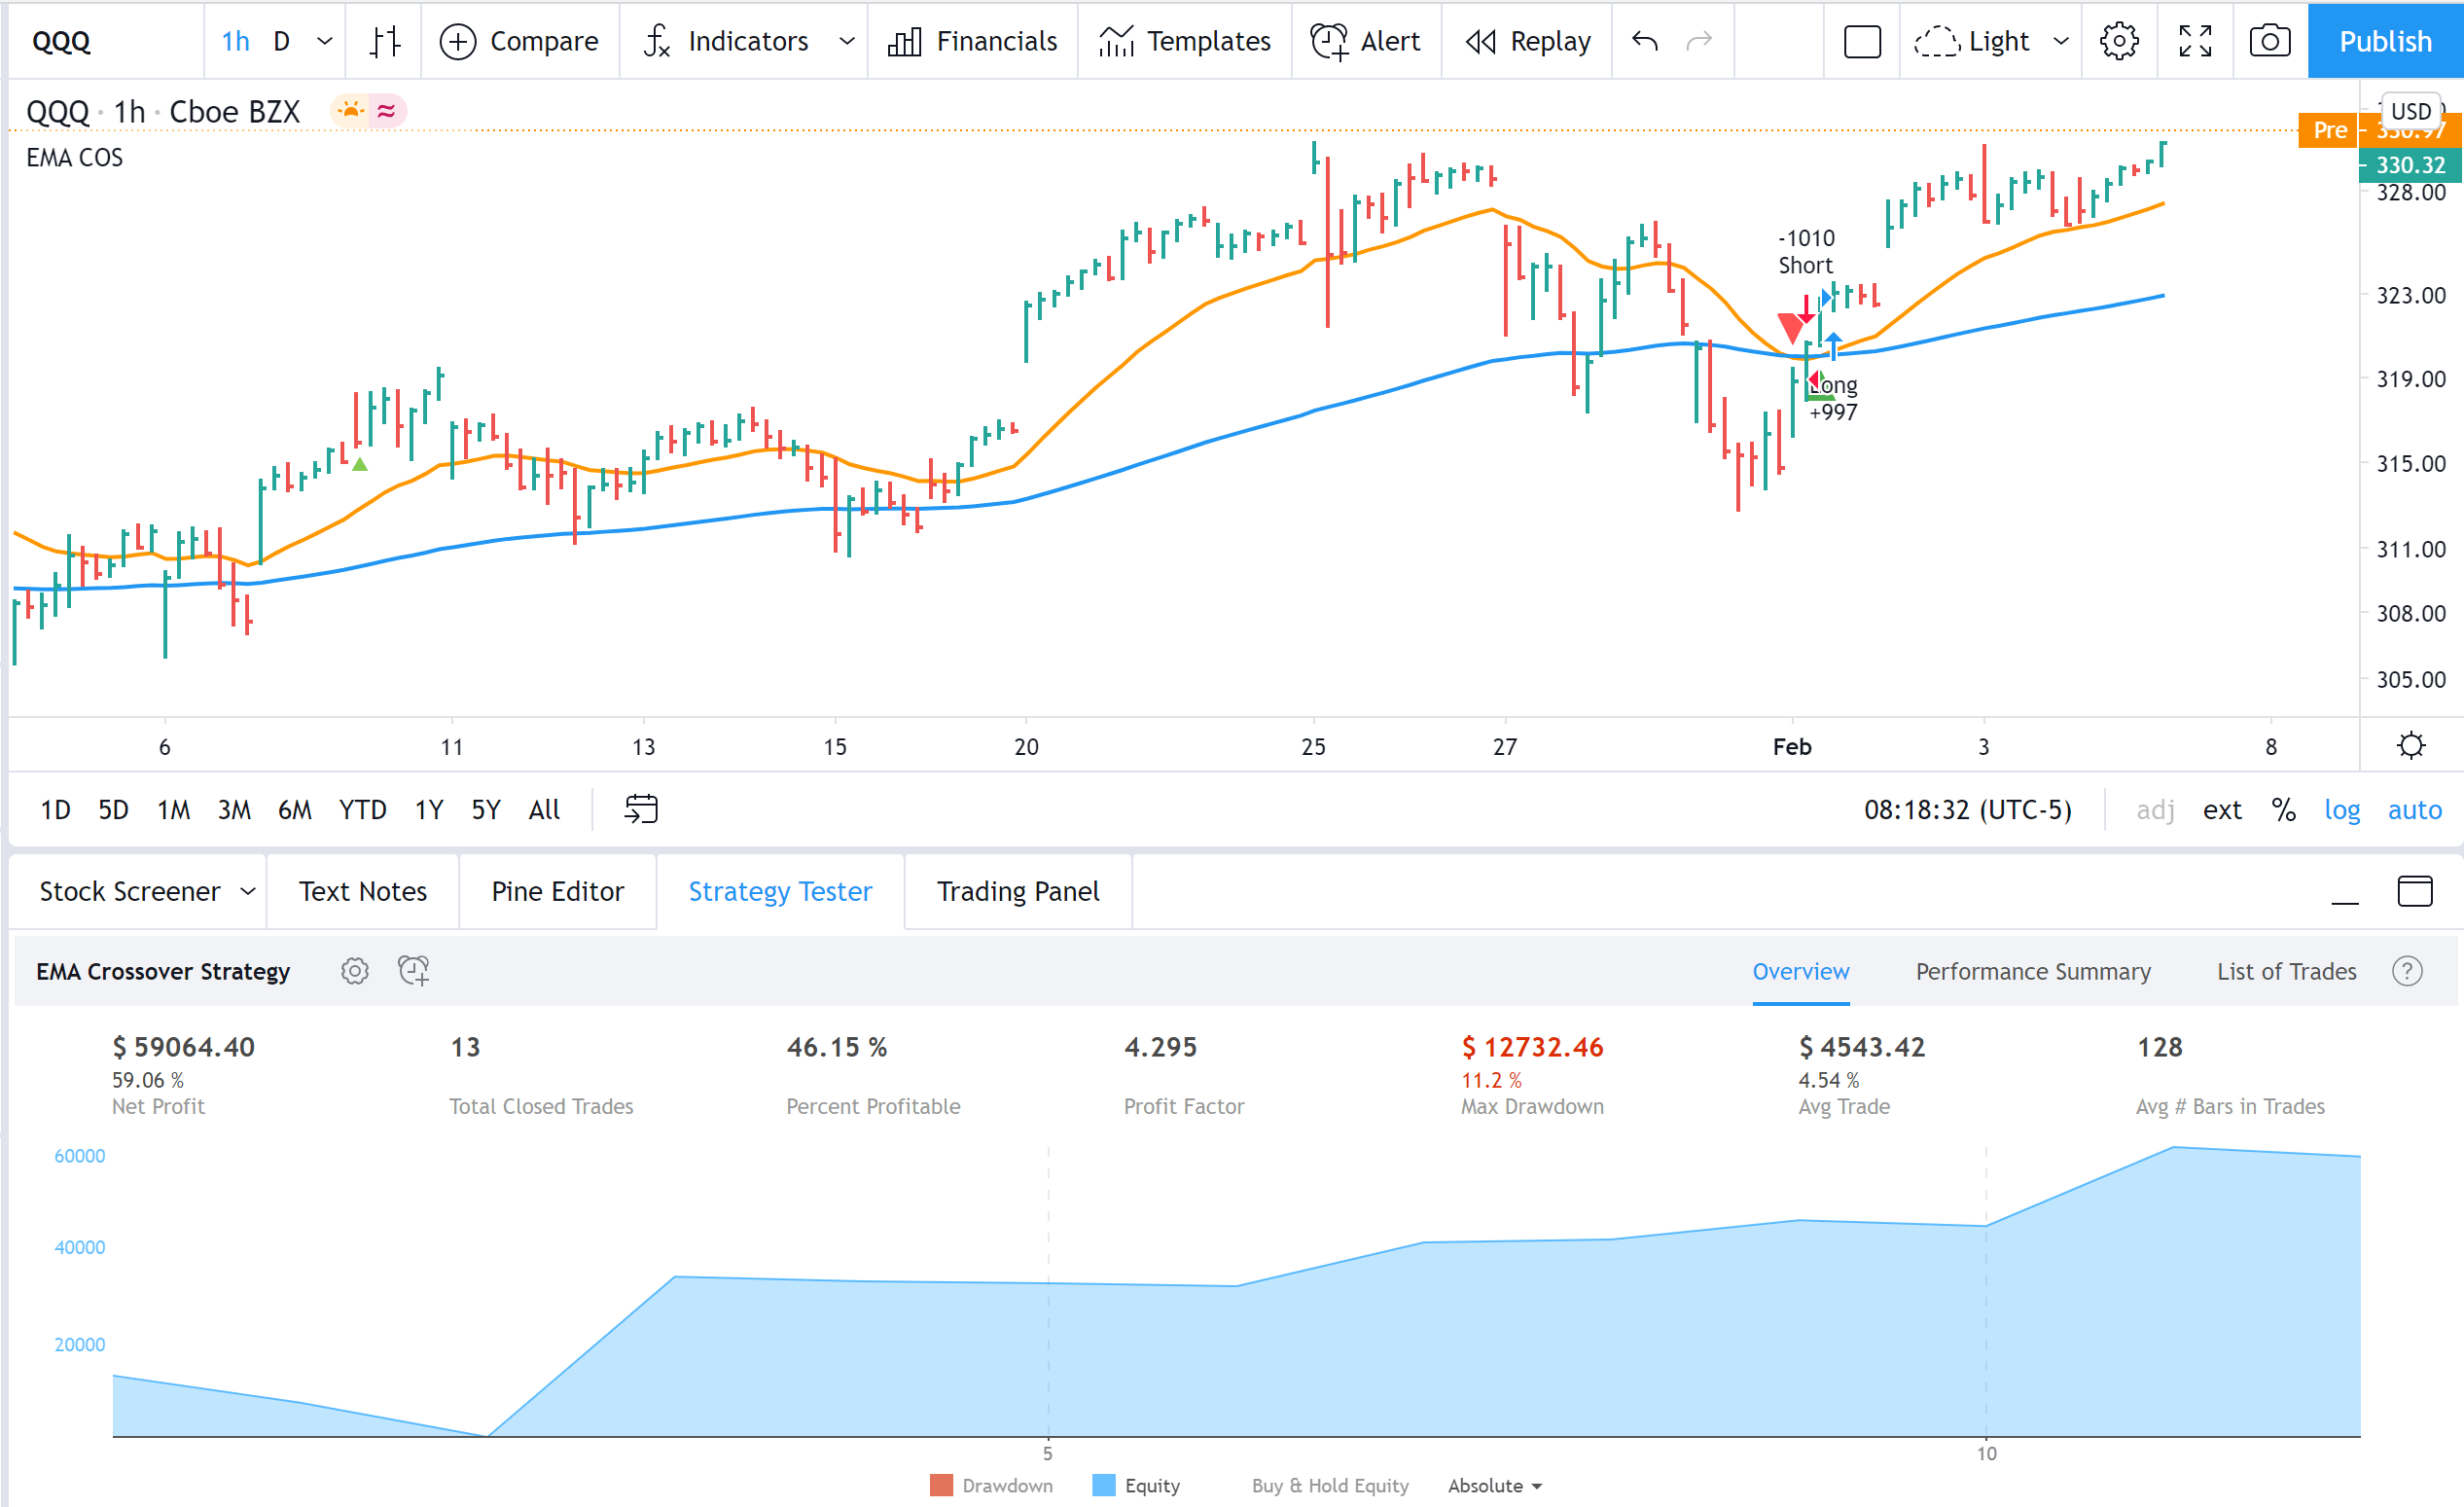
Look at the above back-test results for 2020 on the NASDAQ.
- 59% net profit
- 13 total trades
- 46% of the trades were profitable
- 4.2 profit factor, which means our winning trades were 4.2 times larger than our losers: this is great!
- 11% max drawdown: from max profit to lowest point was 11%, this is also great!
- 128 bars average holding time for the trade, which means on the 1 hour chart with 6 hours in a trading day equals 21 days average holding time.
Using the back-test results, we can answer the following questions:
- Will the majority of the trades be profitable?
- No, more than 50% of them will lose. This is normal! As long as our winners are bigger than our losers, we’ll make money overall. High win rate (>50%) trading systems that promise ~1,000% profit in a month are always scams.
- Will I get rich overnight?
- No, EVERY trading strategy takes years to play out. Starting with $1,000 and expecting to go to $1,000,000 in a year isn’t realistic. However, it’s possible with compounding wins means getting rich in a few years.
- Can’t I just increase the leverage to speed things up?
- Yes and no. Increasing the leverage also increases the drawdown. EVERY trading strategy will have losses, and suffering 50% drawdown (or worse!) is terrible.
Summary
EMA crossover strategies have stood the test of time. They work in all markets and timeframes.
Steps to create a profitable EMA crossover strategy:
- Go watch my video on how to create an EMA crossover strategy.
- Use my back-testing tool to find the right market, timeframe, and EMA lengths.
- Set up automated alerts on TradingView, so you can trade from anywhere with little time invested.
- Trade!