The RSI indicator is garbage. It’s also the most popular trading indicator. What’s wrong with it, and why don’t people know it’s bad?
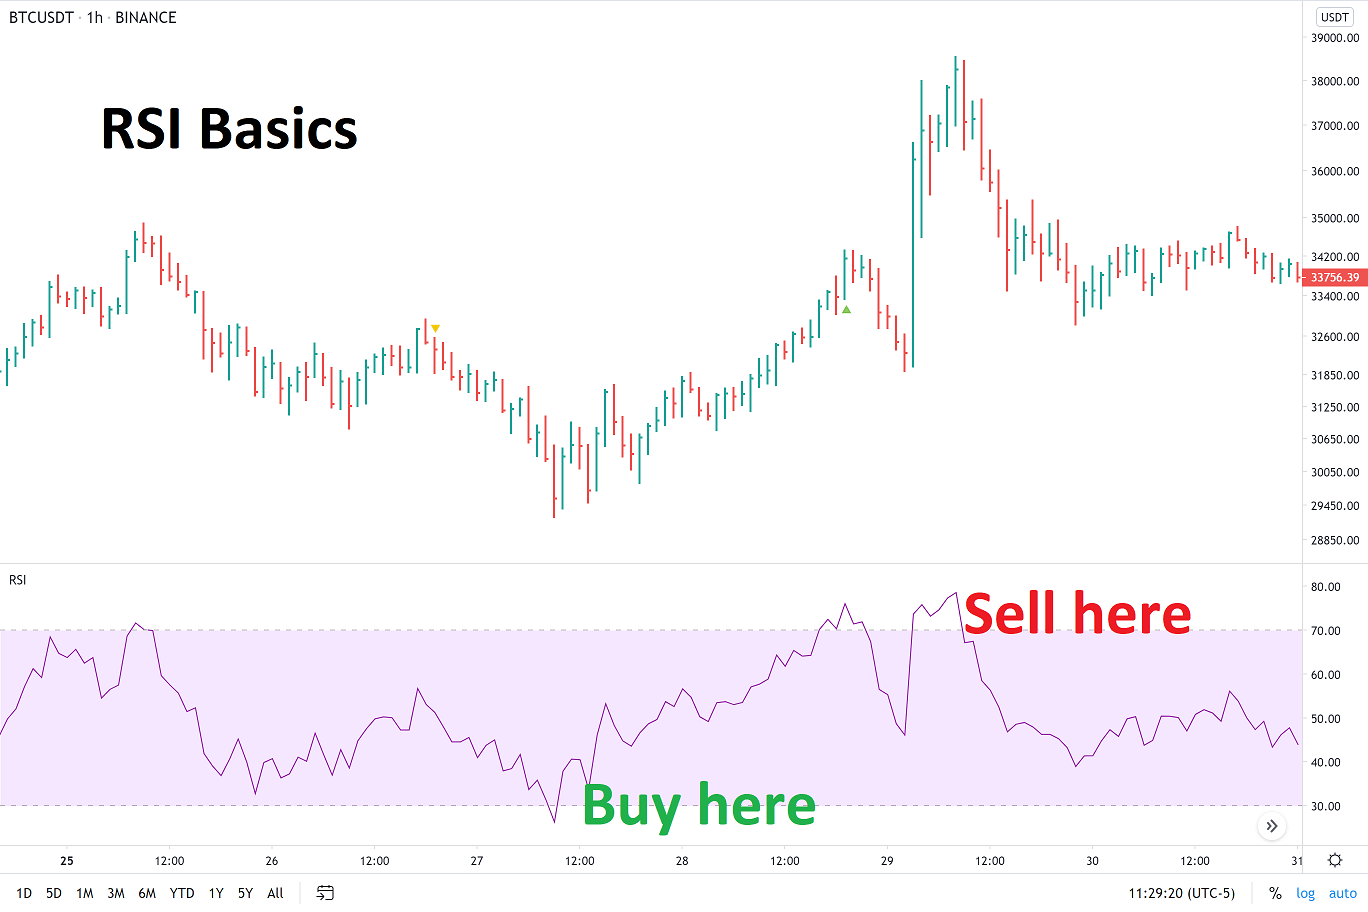
What is RSI?
RSI stands for “Relative Strength Index”, created by Welles Wilder Jr. in the 1970’s in his interesting-yet-flawed book New Concepts in Technical Trading Systems. Wilder created a lot of trading systems and indicators still in use today, such as Average True Range and Average Directional Index.
I won’t bore you with the math because it doesn’t matter as long as you know the underlying idea. Check the wiki for the math.
The idea behind RSI is wrong
The idea behind RSI is when price moves too far in one direction that it’ll reverse. This is called “mean reversion”. If you’ve researched trading indicators, you’ve seen such words like “stochastic” or “Gaussian”, which are the same idea. The idea is that price will return to “normal”. The problem is we have over 100 years of data that shows this isn’t true, and has never been true.
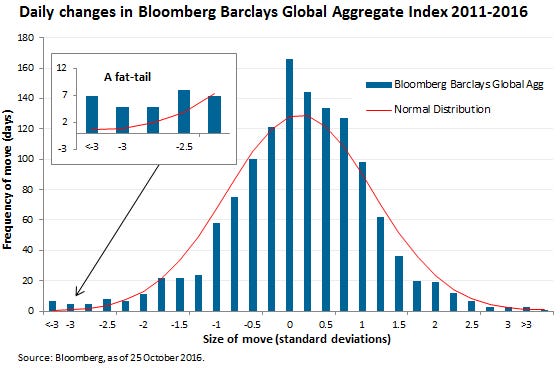
The red line is a normal/stochastic/Gaussian distribution, which is what RSI and all other oscillators expect to happen. The blue bars are what actually happens:
- The markets are mostly flat with rare, large downward movement.
- The markets drift upward with rare, large downward movement.
What does this mean?
- RSI will tell you to keep buying a market in free fall.
- RSI will tell you to keep selling a rising market.
- RSI will have you trading choppy, go-nowhere markets.
You couldn’t design a worse indicator. RSI is designed to miss the largest moves and pay the most in fees.
All of the data we have about the financial markets says that they’re NOT normally distributed. Wilder created RSI and the rest of his indicators when there wasn’t a way to test them on the markets. But now that anyone can run simulations on software like TradingView, we can see that RSI has always lost money.
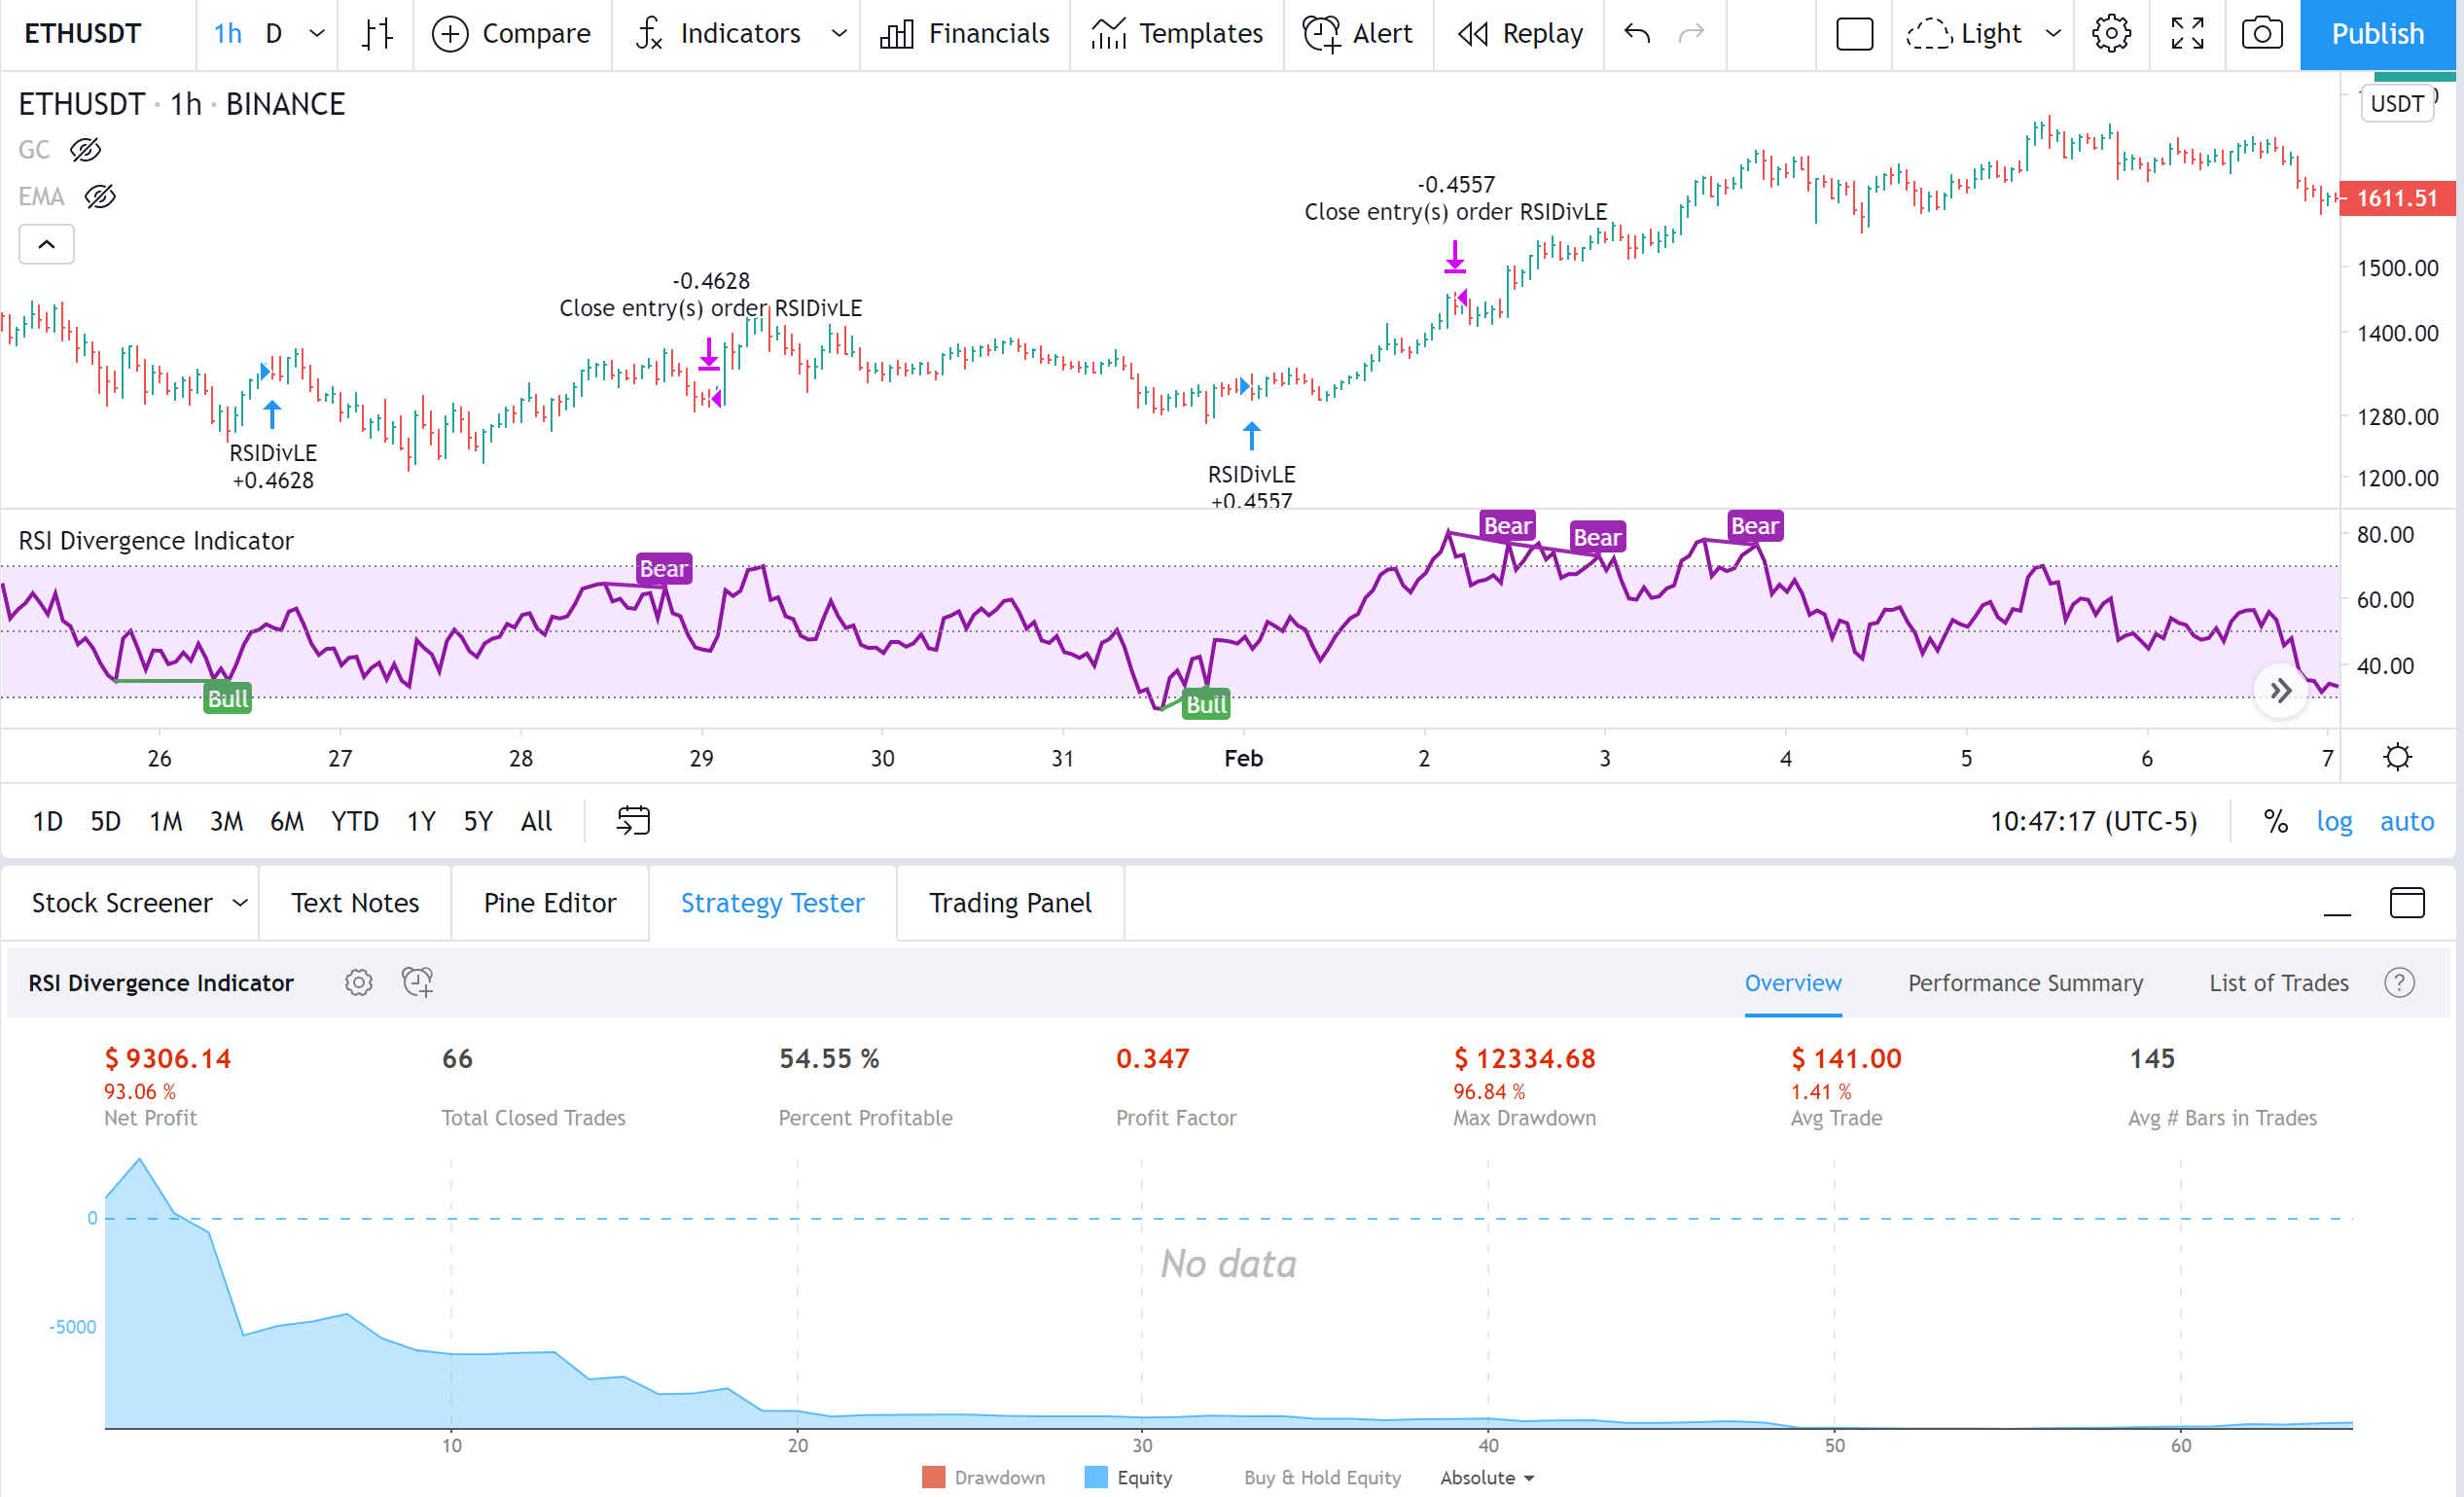
But what about divergences?
Click here if you don’t know what divergences are.
Divergences are confirmation bias bullshit. The idea behind divergences is the market is losing momentum in that direction. The problem is they have no statistical validity in any market and they never have. Anyone suggesting divergences should be ignored forever.
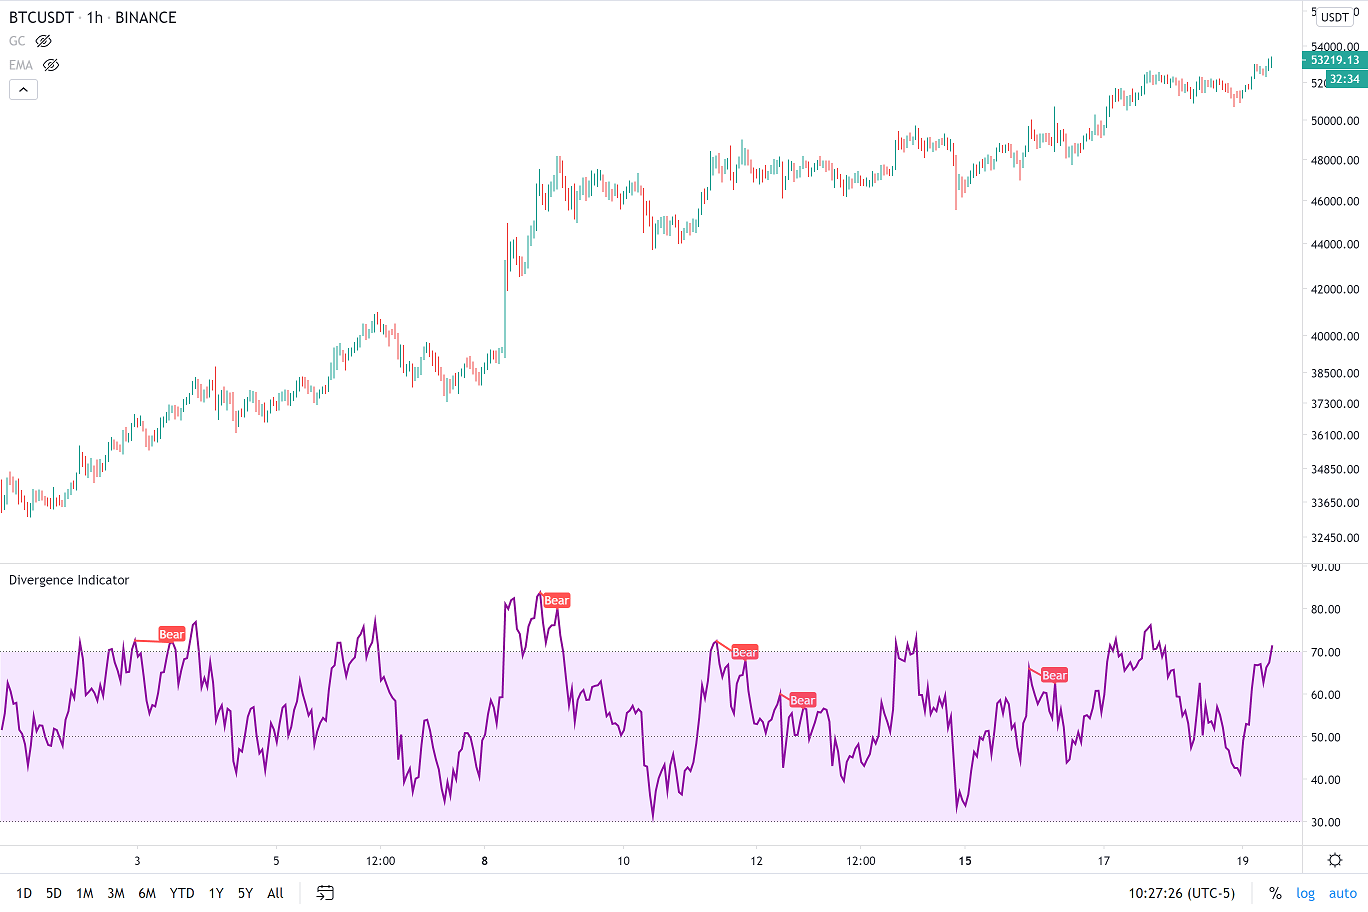
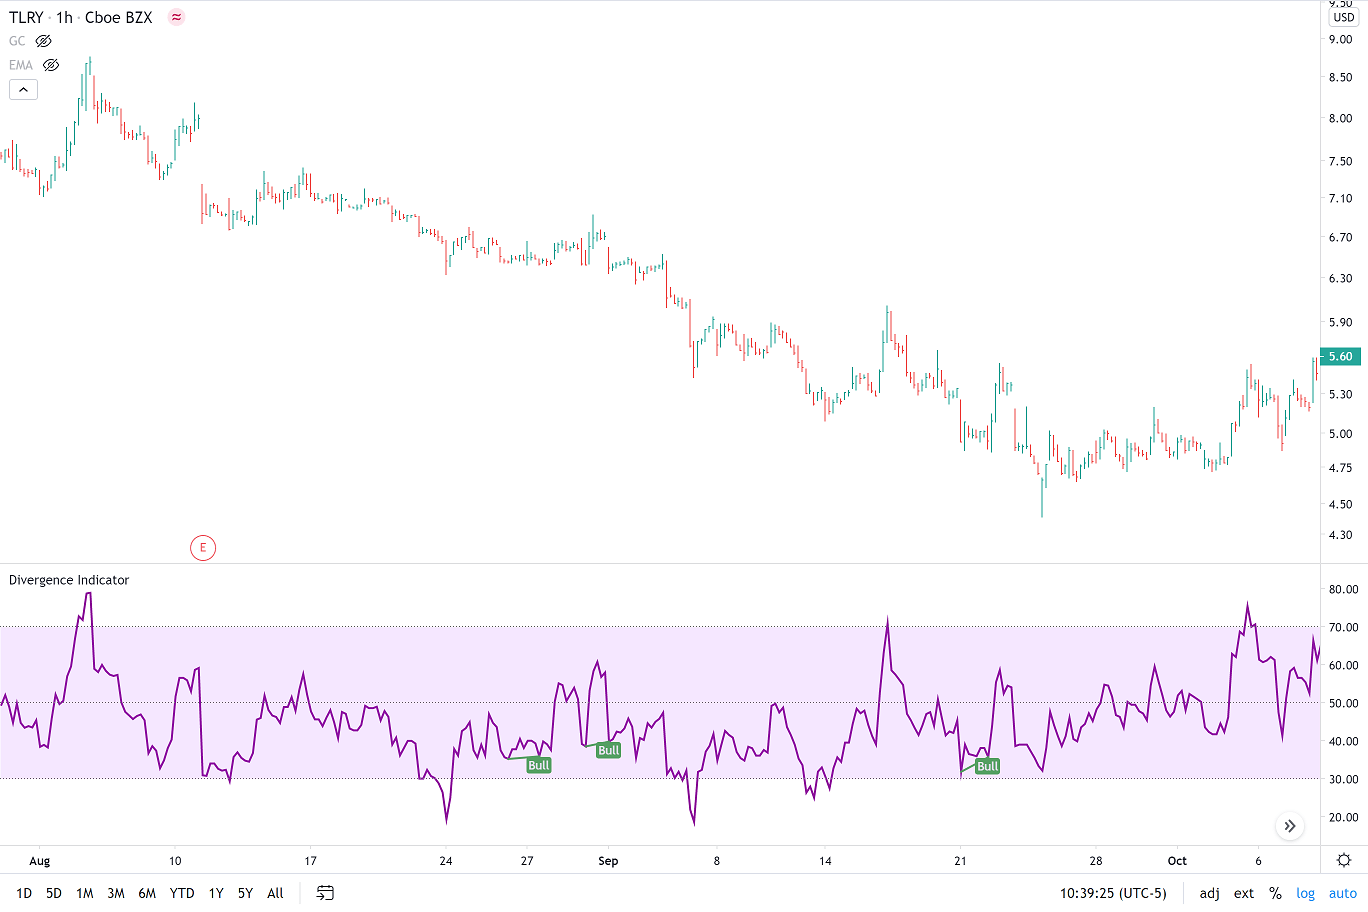
In uptrends, RSI rarely reaches oversold. In downtrends, RSI rarely reaches overbought. RSI will have you doing the exact wrong thing in every big move!
What if you combine RSI with another indicator?
The most common idea is to combine RSI with something like the Average Directional Index. Basically, we only want to take RSI signals when price is in a range rather than a trend. Sounds good, right? Well, now we get to problem #3: trading sleepy markets. There’s not enough movement to overcome the fees or the eventual black swan (huge loss). This is summed up by the phrase: “picking up pennies in front of a steam roller”.
Why haven’t people figured out RSI is bad?
The markets have only gone up for the past 100 years due to inflation. Crypto has gone up a literal 5,000,000,000% in the past decade. If you were long more than short, you made money. It’s as simple as that. Even blindly buying the market every week/month/year made money (the technical term is “Dollar Cost Averaging“). There are plenty of traders who use RSI and still make money because the markets basically only move one direction: up.
Summary
In an interview, RSI creator Welles Wilder Jr. was asked how he lost his money. His wife interjected: “He lost it trading”.